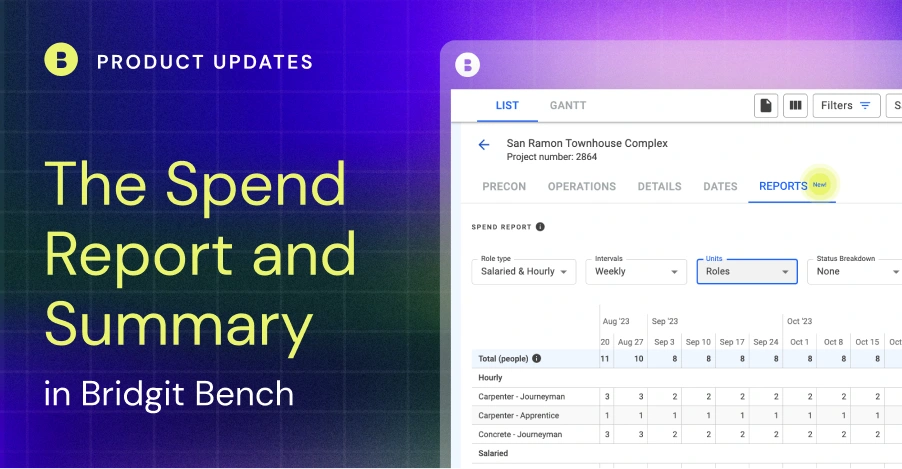
TL;DR – There are two new Spend Reports in Bridgit Bench. The Project Spend Report in your projects provides a detailed look at the resources required to staff a specific project. The Workforce Spend Summary in the forecasting dashboard provides a corporate-level view of every project in your pipeline. Now, you can see top-level totals and project-level breakdowns of your costs, roles, and hours. Oh yeah, both reports can be viewed in monthly and weekly increments, so you can dial right in.
Table of Contents
Understanding the cost of staffing is tough
From an individual project to the entire project pipeline, looking at the cost of your staffing plans and workforce is hard to consolidate quickly and keep accurate.
However, understanding the cost of staffing is invaluable to keeping labor costs on track and making changes to projects on the fly or changes to the pipeline if costs aren’t tracking in the right direction.
Well, Bridgit Bench has a solution for both – a Spend Report built right into every project and a Spend Summary in your Forecasting Dashboard.
Let’s start at the project level and work our way up.
The Project Spend Report
The Spend Report, found in your Project Reports, is where you’ll find project-specific insights and a summary of the labor required to satisfy the project’s staffing plan. The report will consider all roles on the project to paint an accurate picture of your resource usage throughout your project.
The Project Spend Report provides better visibility into the total resource demands of each project, keeping you closely connected and helping to track and understand, in detail, the impact of project changes and project-specific variables and outcomes. The report was also built to be flexible, so each user can display the staffing and resource plan in the most helpful way.
- Example #1 – Your Field Manager wants an overview of their craft workforce, week over week, but also wants to see the number of unfilled roles they’ll need to fill to support the project. Done.
Image?
- Example #2 – Your Operations team wants a detailed cost breakdown of the entire project team at a high level and which months will be the peak resource spend. Easy.
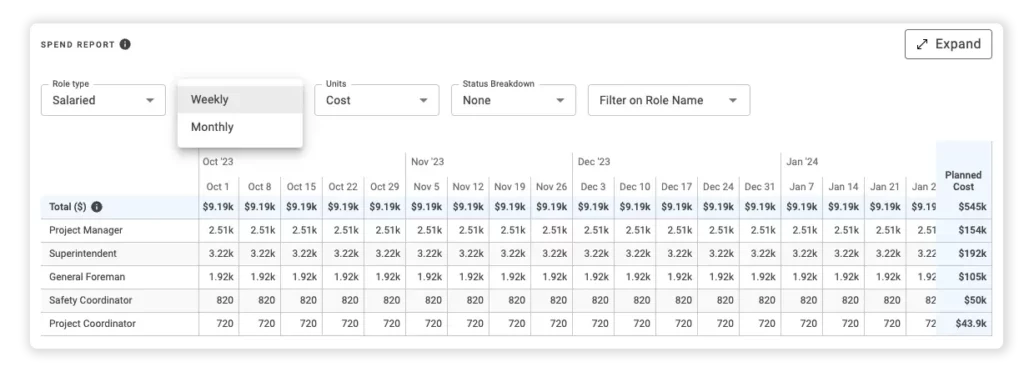
Your ops team can access historical Spend Reports to get a better understanding of how costs previously ramped up and down on similar projects to help inform staffing plans on current/upcoming ones. And your precon team can use the same information to help inform labor budgeting and estimates.
Customizations? You got it. The Project Spend report is fully configurable:
- Display your entire project team or just your hourly or salaried workforce.
- View your project in monthly or weekly intervals for a more detailed breakdown.
- Display the information that matters to you. Hours? Costs? Filled and unfilled roles? We’ve got you covered.
For a detailed, step-by-step walkthrough of the Project Spend Report and Workforce Spend Summary, visit the Bridgit Help Desk here.
The Workforce Spend Summary
Where the Project Spend Report was built for project-level insights, the Workforce Spend Summary was built to provide a 10,000 ft. view of the roles, costs, and hours required to staff your entire project pipeline.
The Spend Summary provides top-level totals for your pipeline AND visibility on every project, which helps to better understand your cost of staffing without needing to comb through and consolidate all your project spend data.
The Spend Summary can help inform high-level workforce planning and forecasting, which is why you’ll find it in your Forecasting Dashboard. It’s the perfect complement to the Supply & Demand Report. One helps to understand your labor demands at a high level, the other helps to explore those demands in greater detail, project by project.
While the Project Spend Report helps to understand the peaks and valleys of resource spending at the project level, with the Workforce Spend Summary, you can understand those same peaks and valleys at the corporate level. Let’s run through an example. Let’s say we want to see how many roles we’ll need to fill to satisfy our staffing plan at a company level, pictured below.
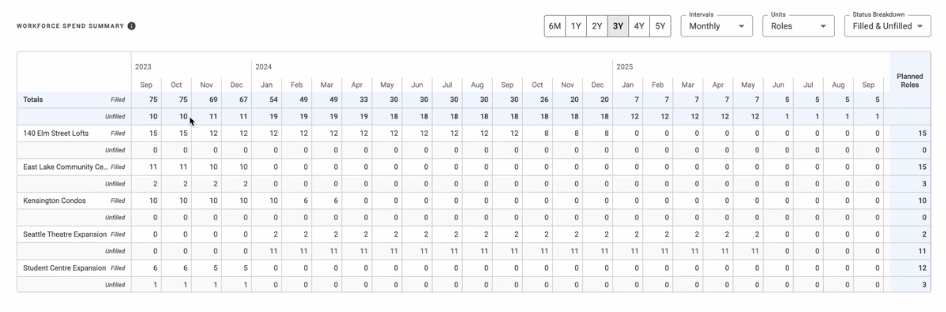
We’ve configured the summary to display our resources as unique roles on our projects, broken down by the role status – filled or unfilled. We’re looking at it month over month and can immediately see we’ve got a lot of unfilled roles over the next 6 months that we might want to get ahead of now.
If you’re running a scenario with your pursuit projects to see the potential impact, the scenario you’ve built will also be reflected in the Spend Summary. Need to see how far a couple of pursuits will push the total planned hours for your company? No problem. Just run the scenario and Bench will provide the insights you’re after.
Just like everything in Bench, we’ve carefully built the Project Spend Report and Workforce Spend Summary to reflect the permission sets you have in place for your team. No one will see financial or cost information they shouldn’t be seeing. To learn more about setting up custom permission sets, get a step-by-step walkthrough at the Bridgit Help Desk.


