Gantt charts are among the most popular methods for visualizing a construction project’s progress. But what is a Gantt chart, and why is it important? Keep reading to learn all of the details.
Table of Contents
What is a Gantt chart, and why is it important?
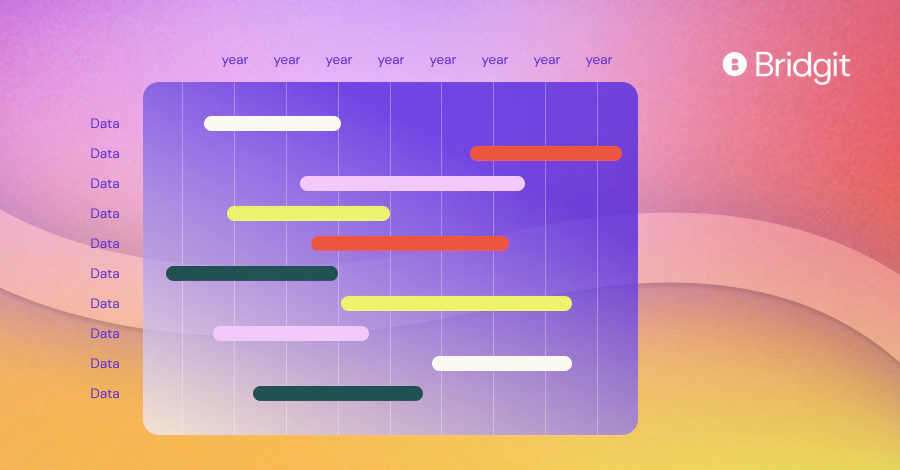
A Gantt chart lays out your project schedule using a bar chart format. This layout effectively visualizes the dependencies between various aspects of the project.
While the Gantt chart was not designed specifically for construction, it offers several advantages for workers and operations teams in this field, which we’ll explore shortly.
A brief history of Gantt charts
The Gantt chart was developed by Karol Adamiecki all the way back in 1896. Around 1910, a man named Henry Gantt introduced an updated version of the chart that more closely resembles what we know today, including interdependencies.
The recorded use of Gantt charts in a construction project context dates back to 1912 when civil engineer Hermann Schurch used something similar.
Gantt charts have, of course, come a very long way since the late 19th and early 20th centuries. Because each chart was drawn by hand, changes in project scope or timing could take hours to visualize.
Chief among the benefits of Gantt charts today is their nimbleness. Whether building a skyscraper or renovating a house, Gantt charts are living, breathing documents that conform to your needs with just a few mouse clicks.

Use your workforce data to create a competitive advantage
Download our white paper to see how effective workforce planning can help stay ahead of labor demands and create a strategic project pipeline.
Key components of a Gantt chart
Every Gantt chart has four main components. Let’s take a quick look at each.
Labels
The Gantt chart format places labels along the y-axis to indicate what you’re organizing.
Traditionally, these labels would consist of your various project components (i.e., “Pour Foundation” or “Install Windows”). Our workforce management software allows you to list personnel along this axis so you can allocate your team’s time efficiently.
Bars
Time runs along the x-axis of a Gantt chart. Bars on the chart attached to each label allow you to visualize duration. For example, if you’re tracking a project, each bar will tell you how long its associated task is expected to take. Each bar will inform you of the associated worker’s availability when tracking your workforce.
Milestones
When tracking a project, you’ll want to identify which tasks are associated with important milestones, such as project phases. These milestones are linked to their relevant bars and easily visualized in the Gantt chart.
Dependencies
As mentioned earlier, one of the major advantages of Gantt charts is the ability to map out dependencies among tasks or resources you’re tracking to help visualize progress and prevent bottlenecks from occurring on specific tasks.

Think your workforce planning meetings could be more productive?
Download our ebook to learn how to run efficient, effective workforce planning meetings with your team.
Advantages of Gantt charts
When attempting to understand why Gantt charts are important, you’ll eventually uncover several tremendous benefits they provide that many other schedule types do not. Let’s take a look.
Easy project visualization
Many other project schedule formats make it hard to visualize important factors like interdependence and resource allocations properly. Gantt charts are fairly unique in the way they conveniently display this information. The layout is so simple that elements of the Gantt chart have been adopted by productivity applications meant for the average person.
In a professional construction context, Gantt charts help you visualize your entire project, including the tasks that must be completed and who takes care of them using what resources. If you want help creating a Gantt, check out this page.
Better team communication
Gantt charts are very useful for running effective construction manpower planning meetings. This is particularly true of meetings conducted with a remote team amid the COVID-19 crisis. Because a Gantt chart offers a complete picture of your project, it can serve as the single source of truth that all discussions get framed around. Plus, you can implement agreed-upon changes immediately because it’s so easy to manipulate Gantt charts using software. This will eliminate the common issue of different teams working off conflicting understandings of what needs to be done.
Measure task progress, not just completion
Chief among the advantages of Gantt charts is the ability to measure progress towards a task’s completion rather than having the task exist in a binary “finished” or “not finished” state. The format allows team members to update a task’s percentage of completion and track task dependencies, which is something many other scheduling layouts lack.
Gantt chart software also has benefits for this particular purpose. The bar layout displays percentage completion very sleekly, which you don’t get with the few other formats with a similar feature.
Encourages fewer time delays
Another key Gantt chart benefit is the layout’s conduciveness to keeping everyone focused and on track. Other planning and scheduling types rely on workers communicating (and subsequently remembering) which tasks and resources are tied to another team’s success. This is a recipe for disaster regarding capacity planning on complex projects and puts projects at risk of not being completed on time. A Gantt chart remedies this so easily that it’s almost hard to believe.
Facilitates transparency
A properly maintained Gantt chart will clarify which workers or aspects of your project are excelling – or stalling. This can help management make effective decisions about where to allocate extra attention and resources to keep things running smoothly.
It also helps contextualize worker output. A particular employee stalling may not be doing so because of incompetence but because an item their role depends on has fallen behind. You wouldn’t be able to deduce this from other schedule layouts.
Increases flexibility
As mentioned a few times now, the ability to see interdependencies is a chief Gantt chart benefit. One of the ways this benefit manifests itself is by encouraging flexibility.
Responsible managers can often fear adjusting other types of schedules that don’t display interdependencies clearly because doing so can have unknown consequences. When you adjust a Gantt chart, however, you can immediately see the ripple effects your change will produce.
If the bar you’re adjusting overlaps with another one, you’ll know there’s a potential conflict. If the change produces a gap between previously adjacent bars, you’ll know some resources will be freed up for allocation elsewhere within that gap.
Popularity
Another key advantage of Gantt charts is their ubiquitous nature. When sharing your schedule with a third party, you can pretty much count on them knowing exactly what they’re looking at.
The popularity of Gantt charts also means software companies have spent considerable resources on implementing the format in programs that help the many organizations seeking such technology. You can find this on our own software, Bridgit Bench.
This means better tools for you to manage your projects and workforce!
We hope this post has answered the question “What is a Gantt chart and why is it important?”
To summarize, Gantt charts are a very convenient way of visualizing the progress of a construction project. The many benefits of Gantt charts are that they can enhance productivity, efficiency, and flexibility in any construction company’s operations. Gantt charts that are updated in real time can also help you track the progress of your projects and improve time management. Check out this article and others on our blog for more tips on improving construction labor management.
Construction Gantt Chart FAQ
What are the benefits of a Gantt chart in construction?
Gantt charts are beneficial because they can help you visualize the entire project, show what tasks need to be completed, and who is responsible for those tasks. A well designed Gantt chart helps to improve team communication, reduce project delays, and help to measure task progress.
How do you use a Gantt chart in construction?
In construction, Gantt charts are used to break the project into smaller, more manageable tasks. The chart will visually display start and end dates of tasks, as well task dependencies and progress. Gantt charts can be a great tool to help you to manage resources and timelines.
Why is the Gantt chart important in construction?
A Gantt chart is important because it helps you see the big picture of your project. It makes it easier to plan, coordinate with your team, and keep the project on track.
Do engineers use Gantt charts?
Yes, engineers use Gantt charts to plan and manage their projects. They help engineers visualize tasks, track progress, and coordinate with other team members efficiently.


